


First and foremost:
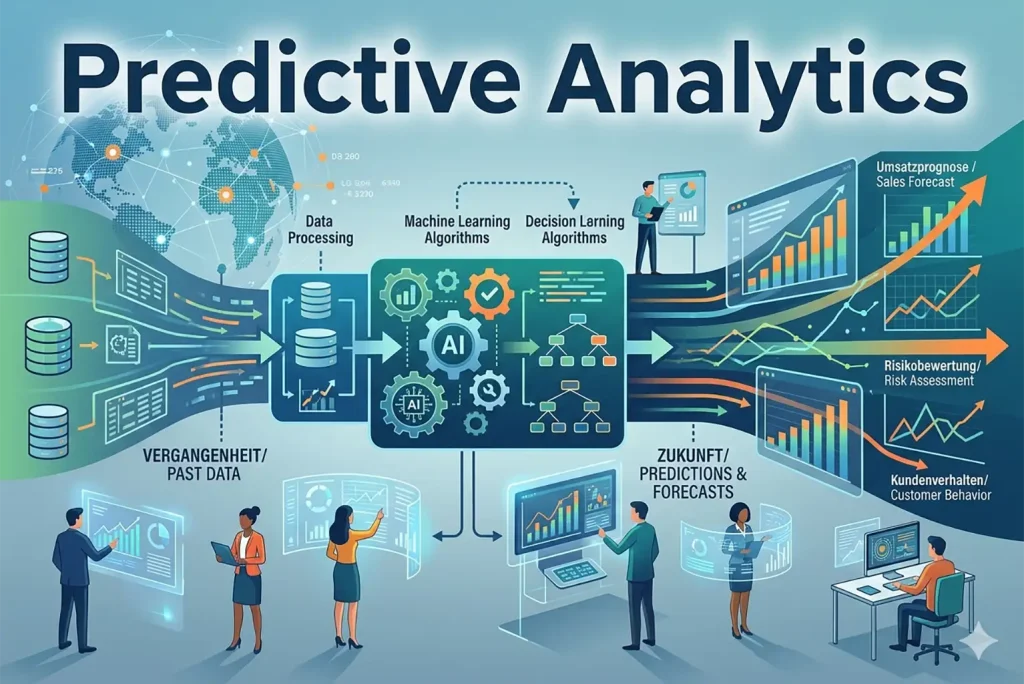
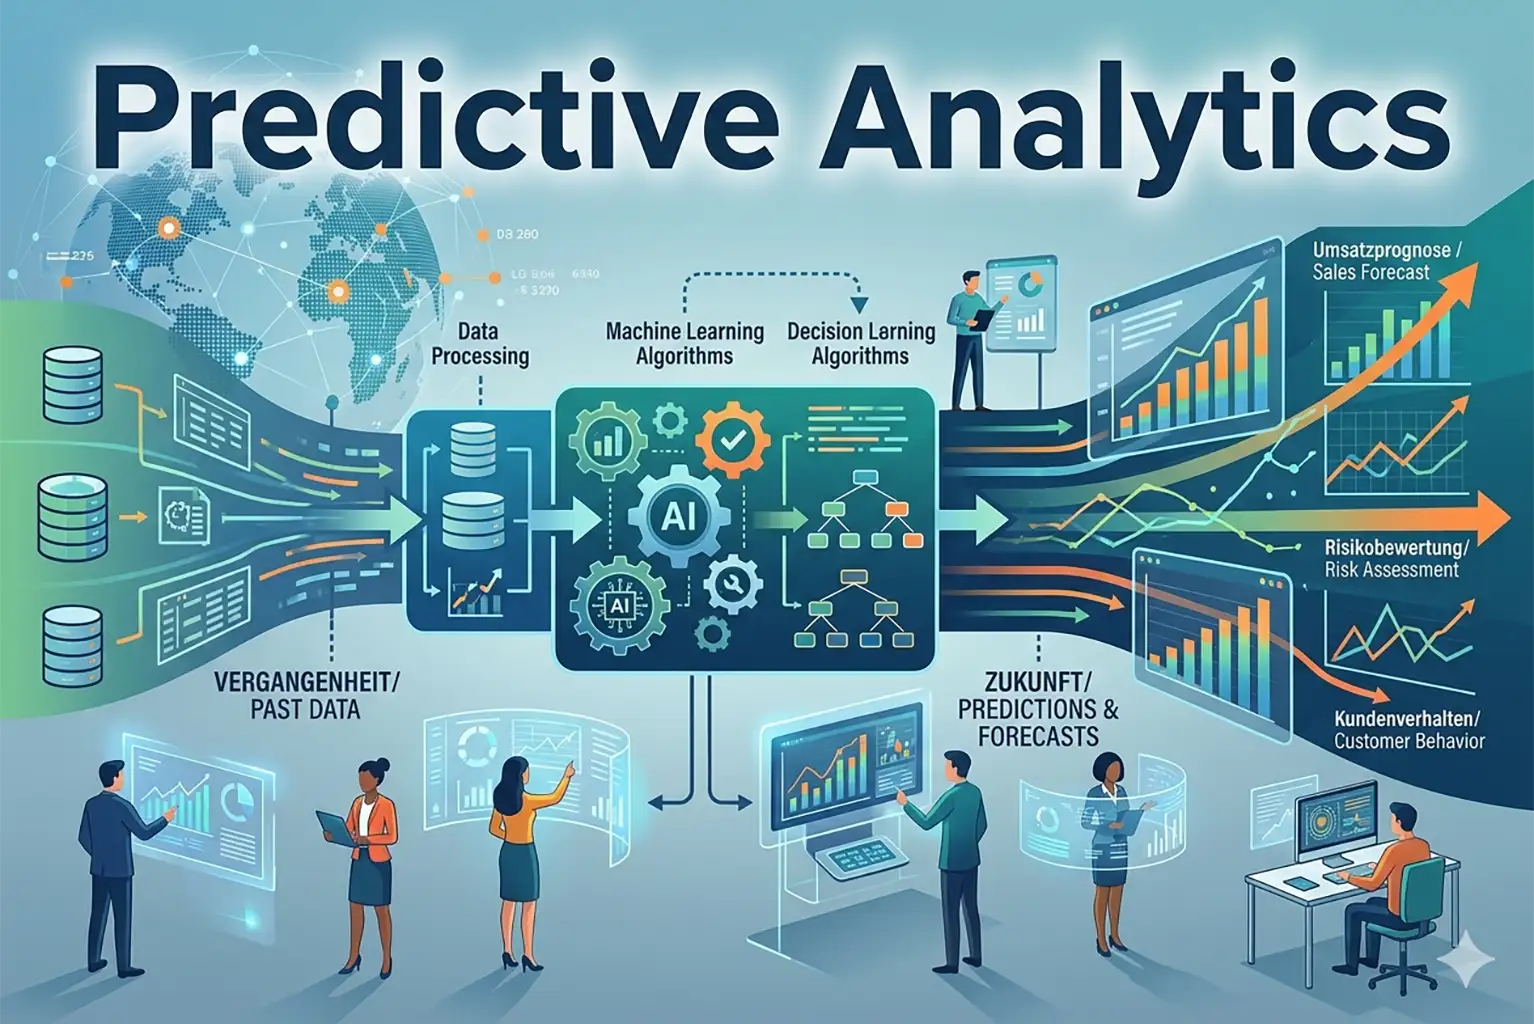
Predictive Analytics uses historical data, statistical algorithms, and machine learning to predict the probability of future outcomes. It's not about „knowing“ the future exactly, but rather creating data-driven forecasts that help companies minimise risks, increase efficiency, and create personalised customer experiences. While classic analytics describe what was, predictive analytics lays the groundwork for proactive strategic decisions.
Predictive Analytics – Key Facts at a Glance
- Core objective: Identification of patterns in historical data to predict future events.
- Technologies: Machine Learning (ML), Data Mining, Statistics, Artificial Intelligence (AI).
- Key methods: Regression analyses, decision trees, neural networks.
- Business benefits: Churn prevention, predictive maintenance, fraud detection, demand forecasting.
- Success factor: The quality of the prediction stands or falls with the quality of the underlying data („Garbage in, garbage out“).
1. Definition: What is Predictive Analytics?
To understand the classification, one must view Predictive Analytics in the context of analytical maturity models:
- Retrospective on the past (Reports).
- Diagnostic: What caused this to happen? (Root cause analysis).
- Predictive: What will happen? (Probability models).
- Prescriptive: What should we do? (Action recommendations based on forecasts).
By linking mathematics, computer science and business intelligence, vast amounts of data (Big Data) are analysed to isolate trends and behavioural patterns. It is the tool that turns a rear-view mirror (past data) into a headlight for the road ahead.
„Data is the raw material of the modern age, but it is prediction that transforms it into valuable knowledge.“
2. How it works: The detailed process cycle
A successful predictive analytics project is not a one-off event, but usually follows a cyclical process:
- Objective definition: What specific business problem is to be solved? Instead of vague objectives like „increase turnover“, precise questions are formulated, such as: „Which customers with an annual turnover > €5,000 have a churn risk of over 20 %?“
- Data Collection: Merging structured data (SQL databases, ERP) and unstructured data (social media, log files, IoT sensors).
- Data Wrangling: This step often takes up 80 % of the time. Outliers are identified, missing values are supplemented using statistical methods, and formats are standardised.
- Modelling: Here, Data Scientists choose the appropriate algorithm. The model is fed a training set to learn patterns.
- Validation & Evaluation: The model is tested with an „unknown“ test set. Metrics such as precision or the F1 score determine reliability.
- Deployment: Integration into operational processes to deliver real-time predictions.
3. Central Methods and Algorithms in Detail
To make precise predictions, data science utilises various mathematical approaches:
Regression analysis
Linear regression examines the relationship between a dependent variable (revenue) and independent variables (advertising budget). Logistic regression is used for yes/no categories (e.g., loan default).
Decision Trees & Random Forests
A graphical model for if-then questions. A random forest combines hundreds of these trees to massively increase accuracy and compensate for the errors of individual trees.
Neural Networks & Deep Learning
Inspired by the human brain, these consist of layers of „neurons.“ They excel at highly complex tasks such as image recognition or language analysis.
Time Series Analysis
Focus on data points in chronological order to forecast seasonality and trends for future values such as energy demands.
Would you like a brief consultation on this?


4. Comprehensive application areas in practice
Predictive analytics transforms decision-making across various industries (mobile-optimised overview):
- E-Commerce: Next Best Offer. Calculation of the item with the highest purchase incentive based on click behaviour.
- Finance: Credit Scoring. Instant assessment of credit default risks and real-time fraud detection.
- Industry: Predictive Maintenance. Avoiding downtime with sensor-based maintenance forecasts.
- Marketing: Churn Prediction. Early identification of customers at risk of churn.
- Logistics: Demand forecasting. Optimising inventory management through regional demand predictions.
5. Practical Example: Churn Prevention through Predictive Analytics
To make the theory tangible, let's consider the scenario of a software vendor (SaaS) using predictive analytics to reduce customer churn.
The starting position:
The company has noticed that 15 % of customers do not renew their subscription after the first year. Manual surveys deliver results too late to sway customers.
The analytical approach:
The Data Scientists feed the model with historical data: activity data (login frequency), support history, and payment behaviour.
The result:
The model identifies a pattern: customers who did not complete the onboarding tutorial within the first 30 days and whose login frequency drops by more than 40 % in the fourth month are 85 % likely to churn.
The measure
Instead of waiting for cancellation, the system automatically triggers a campaign. The Customer Success team proactively contacts these customers. Result: The churn rate dropped by 20 %within six months.
6. Best practices for implementation within the company
The successful introduction of predictive analytics within a company is less a purely technical project and more of a strategic transformation. A clear roadmap is required to bridge the gap between complex data models and genuine business value. Without being embedded in the company culture, even the most precise algorithms will remain ineffective.
- Start Small, Scale Fast: Begin with a „Minimum Viable Product“ (MVP) to demonstrate quick successes. A narrowly defined use case generates faster adoption than a multi-year mammoth project.
- Data quality over quantity: establish clear processes for data maintenance (data governance). As models are based on patterns, faulty data leads to biased results („garbage in, garbage out“).
- Interdisciplinary Teams: Data Scientists must work closely with the specialist departments. An algorithm can identify correlations, but only the subject matter expert can assess whether these are causally relevant.
- Ethics and Data Protection (GDPR): Transparency in automated decision-making is mandatory. Users must be able to understand the basis on which a scoring is generated.
- Promoting a culture change: Management and employees must learn to make decisions based on data rather than just intuition. This requires training and a willingness to critically question „gut feelings“.
7. Feature Engineering and Model Selection – The Heart of the Analysis
Behind the scenes, the preparation of data characteristics, known as feature engineering, is what primarily decides.
What is Feature Engineering?
It is the process of transforming raw data into features that better represent the problem. Experts create new variables such as Recency (days since last interaction), Frequency, and Trend indicators.
Choosing the right model
Data scientists must balance interpretability and performance. A simple decision tree is easy to explain, while a neural network often offers higher accuracy, but remains a „black box“.
„Those who understand the patterns of the past can set the course for the future before it arrives.“
8. Critical Challenges and Pitfalls
Despite the enormous potential, the path to functional predictive analytics is paved with hurdles, often of a technical, organisational or cultural nature. Awareness of these stumbling blocks is the first step in preventing costly project failures.
- Data silos: The lack of data exchange between departments prevents a holistic view. Without connecting all data sources, the model remains incomplete.
- Overfitting: The model performs perfectly on historical data but fails in new market situations because it has misinterpreted random fluctuations as fixed rules.
- Lack of explainability (black box): If the AI's logic is not comprehensible, acceptance decreases. Especially in regulated industries, decisions must remain legally justifiable.
- Data Drift: Models become outdated when real-world behaviour changes sharply (e.g., due to crises). A model requires continuous monitoring and retraining.
- Lack of data strategy: Without an overarching strategy that defines the questions the data is intended to answer, analytics efforts often come to naught.
9. Conclusion: The Strategic Importance of Predictive Analytics
Predictive Analytics is not a glimpse into a crystal ball, but applied mathematics and computer science at the highest level. In an increasingly volatile world, the ability to learn from the past for the future is the crucial competitive advantage. Companies that successfully integrate predictive analytics into their DNA not only gain efficiency but also develop an agility that determines market survival in the age of digital transformation. The path to this leads through a clean data strategy, technological curiosity, and the willingness to rethink corporate culture on a data-driven basis. Humans remain indispensable as correctional and strategic forces, as they provide meaning and direction to the numbers. Ultimately, predictive analytics is far more than just a technical feature; it is the foundation for future-oriented, proactive corporate management in a data-saturated economy.
10. FAQ: Predictive Analytics – Expert Questions Answered
Do I absolutely need Big Data for predictive analytics?
No. Excellent results can also be achieved with „Small Data“, provided this data is representative and clean. Quality almost always beats quantity.
What is the difference between predictive analytics and machine learning?
Predictive Analytics describes the business goal (making predictions). Machine Learning is the technological method (algorithms that learn from data) to achieve this goal efficiently.
How accurate are models like these?
This depends on the case. In industry (maintenance) or marketing, accuracies of well over 90 % are often achieved, while financial markets remain more volatile.
Is the implementation affordable for small and medium-sized enterprises?
Yes. Thanks to cloud computing and „Analytics-as-a-Service“, high upfront investment costs for one's own hardware are eliminated. You only pay for the computing power actually used.