


Key facts about purchasing controlling
- Core task: Holistic planning, control and monitoring of all procurement activities to increase return, liquidity and security of supply.
- Key control KPIs: Spend under Management (SuM), cost reduction vs cost avoidance, maverick buying rate, OTIF rate (On-Time In-Full), process costs per order.
- Hybrid approach: Parallel measurement of hard P&L savings (with controlling alignment) and strategic value contributions (ESG compliance, risk minimisation, innovation partnerships).
- Target benchmarks: Assets under management > 85 %, Maverick Buying < 5 %, level of automation (touchless orders) > 75 %.
The significance and strategic role of procurement controlling
In many companies, however, a classic conflict still persists: the procurement department reports significant success in negotiations, yet at the end of the year, financial control cannot find these amounts reflected in the profit and loss account. The reasons for this include increases in purchase volumes within the business units, unchecked price adjustment clauses or uncontrolled procurement carried out without the purchasing department’s involvement.
„Cost savings that cannot be verified in black and white in the profit and loss account at the end of the year simply do not exist for the company’s management.“
This is precisely where modern purchasing controlling comes in as a business partner:
- Expenditure transparency: Comprehensive reconciliation and categorisation of expenditure by product group, location and supplier.
- Robust baseline logic: establishing standardised rules for how savings are measured and aligned with departmental budgets.
- Early risk warning: monitoring supplier credit ratings, delivery reliability and concentration risks before line stoppages occur.
- Strategic decision-making support: Data-driven decision templates for make-or-buy analyses, payment terms negotiations and sourcing strategies.
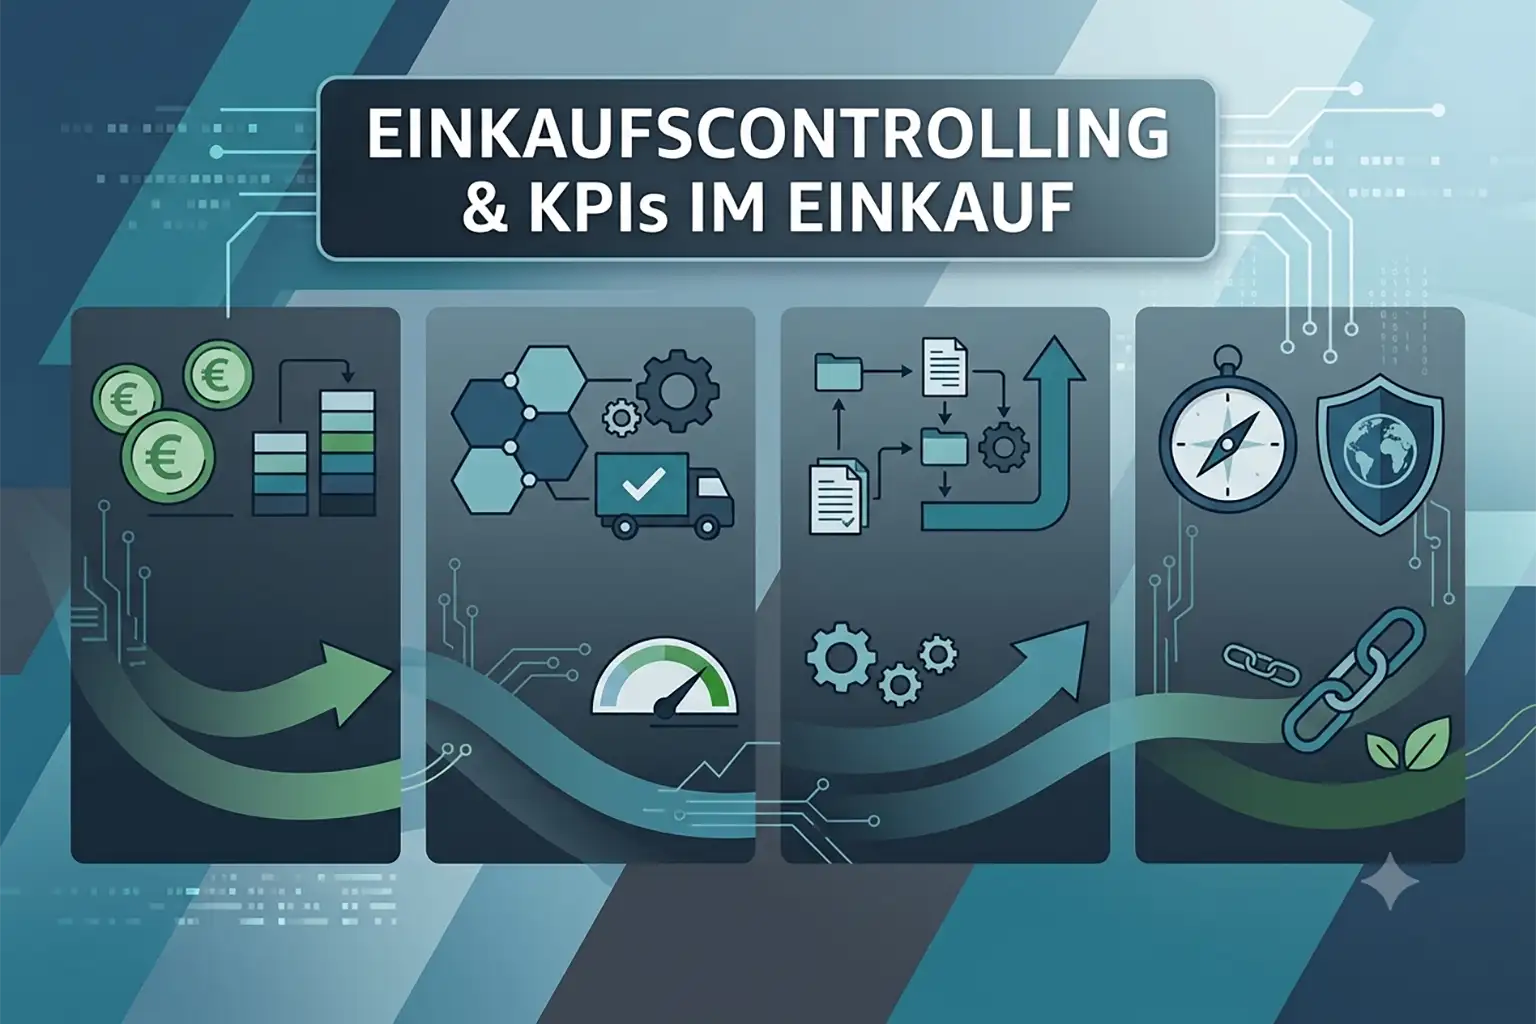
The 4-pillar framework for procurement KPIs
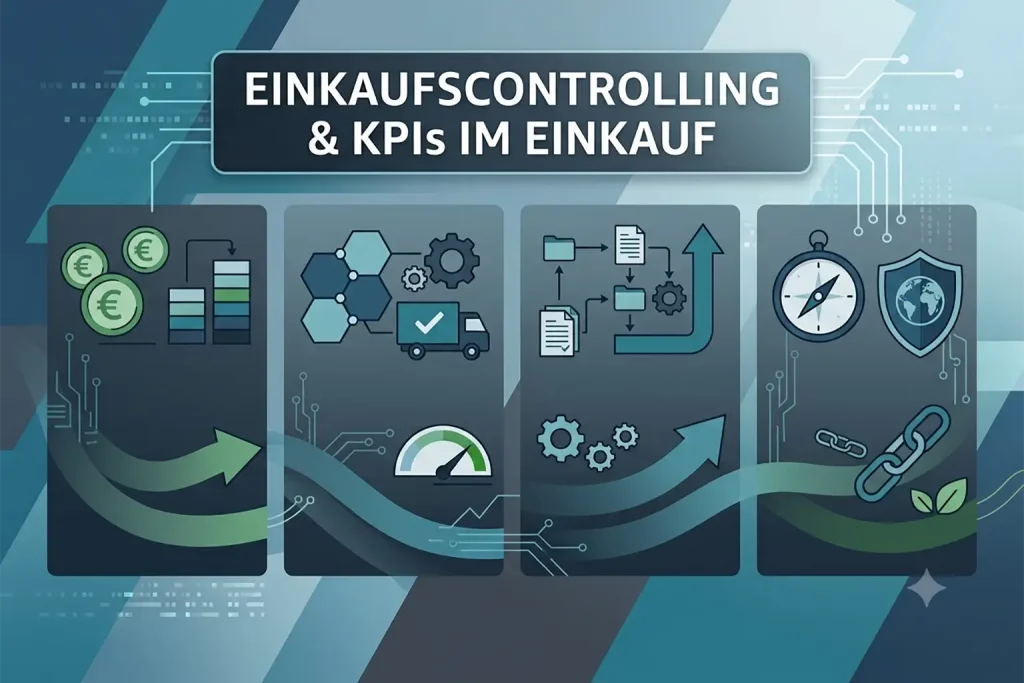
A balanced system of key performance indicators takes a holistic view of procurement and prevents operational efficiency or delivery quality from being sacrificed in favour of short-term price advantages.
- 1. Cost and financial indicators
- Focus: Immediate relief for the profit and loss account and cash flow
- Key KPIs: Cost reduction, cost avoidance, maverick buying rate, days payable outstanding (DPO)
- 2. Supplier performance & quality
- Focus: Reliability and accuracy of supply partners
- Core KPIs: OTIF rate (On-Time In-Full), defect rate (PPM), supplier performance score
- 3. Process Excellence & Efficiency
- Focus: Streamlining and automation of procurement processes
- Key KPIs: Turnaround time for purchase requisitions (BANF), cost per purchase order (Cost per PO), proportion of automated orders (Touchless Orders)
- 4. Risk & Compliance
- Focus: Supply chain security and compliance with legal requirements
- Key KPIs: single-sourcing rate, audit coverage (e.g. in accordance with the LkSG), risk score for critical A-suppliers
The key purchasing KPIs in detail (including formulas)
1. Cost and financial metrics
- Cost reduction (hard savings / affecting the P&L):
Compare the newly negotiated price directly with the historical previous year's price (baseline) under identical specifications.
Formula: Cost reduction in % = ((Base price – New price) / Base price) * 100 - Cost Avoidance (Cost Avoidance / Soft Saving):
Measures the difference between a requested price increase (or the current market index) and the price actually agreed upon.
Formula: Cost Avoidance = Requested Price – Final Negotiated Price - Maverick buying quote
Captures the proportion of purchasing volume that is ordered by departments without the involvement of purchasing and without using existing framework agreements.
Formula: Maverick buying ratio in % = (Purchasing volume excluding framework agreements / Total purchasing volume) * 100 - Spend under Management (SuM):
The percentage of the addressable spend that is actively managed through product group strategies and procurement contracts. Target figure for mature organisations: at least 85 %.
2. Quality and performance metrics
- OTIF Quote (On-Time In-Full):
The toughest metric for on-time delivery. An order is only considered fulfilled when the correct quantity arrives in the agreed quality exactly on the requested date.
Formula: OTIF in % = (number of on-time and complete deliveries / total number of deliveries) * 100 - PPM Rate (Parts per Million):
Error rate in material purchasing, based on one million delivered parts.
Formula: PPM = (number of defective parts / total number of delivered parts) * 1,000,000
3. Process and automation metrics
- Level of automation (Touchless Orders):
Proportion of orders that run fully automatically in the system without manual intervention from requirement receipt to invoice approval. - Order processing time (Cycle Time):
Time required from internal release of the purchase requisition to sending the order to the supplier. - Processing costs per purchase order (Cost per PO):
Total operating costs of the purchasing department (personnel, systems, overheads) divided by the number of purchase orders generated.
Would you like a brief consultation on this?


The hybrid model: Financial versus strategic value contributions
In many companies, the recognition of purchasing fails because exclusively price reductions are measured. The hybrid model brings together financial and qualitative key performance indicators:
Financial dimension (hard facts):
- P&L-effective price reductions with monthly countersigning by financial controlling
- Liquidity improvement through extension of payment terms (DPO) and utilisation of settlement discounts
- Reduction of inventory through consignment stores and Kanban agreements
Strategic dimension (qualitative added value):
- Mitigation of supply bottlenecks through the targeted establishment of secondary suppliers (dual sourcing)
- Compliance with statutory due diligence obligations (e.g. Supply Chain Due Diligence Act / LkSG) and ESG standards
- Early involvement of key suppliers in development phases to reduce future manufacturing costs
Deep Dive: Total Cost of Ownership (TCO) in Purchasing Controlling
Anyone who only looks at the initial purchase price often buys too expensively. Particularly in the case of machinery, tools, IT infrastructure or chemical precursor products, the actual purchase price often makes up only a fraction of the total costs. The TCO method calculates all costs over the entire lifecycle.
„Whoever focuses only on minimising unit prices in procurement often pays the price several times over later on through rework, stoppages and downtime.“
Formula for TCO calculation:
TCO = purchase costs + operating costs + maintenance costs + disposal costs – residual value
The three phases of a TCO analysis in practice:
- 1. Pre-Transaction (Pre-Transaction Phase & Procurement):
- Supplier qualification, sampling and technical approvals
- Contract drafting, legal advice and risk assessment
- freight, customs duty, transport insurance and packaging costs
- 2. Transaction (Running operations & usage):
- energy, lubricant and resource consumption
- setup costs, tool wear and training times for operating personnel
- quality failure costs caused by scrap, rework or warranty claims
- cost of capital tied up in safety stock
- 3. Post-Transaction (Follow-up & Utilisation):
- Maintenance and repair costs, availability of spare parts
- Downtime costs in the event of unplanned machine breakdowns
- Costs for dismantling, proper disposal and recycling
Practical benefit: Using a well-founded TCO calculation, purchasing controlling can prove to departments why a supplier with a 5 per cent higher unit price is ultimately the more cost-effective choice for the company as a whole.
Practical example: KPI-driven procurement transformation in the SME sector
A medium-sized mechanical engineering company with an annual purchasing volume of 80 million euros struggled with non-transparent procurement channels, rising C-parts costs and constant disputes between the head of purchasing and the CFO regarding actual savings.
1. Initial situation before the project:
- Assets under management stood at just 52 %
- The Maverick buying ratio was 27 % (primarily for consumables and supplies, as well as consultancy services)
- The OTIF rate stood at a disappointing 76 %, which regularly disrupted assembly planning
- No uniform definition of baselines; savings were not visible in the financial report
2. Implemented measures:
- Master data cleansing: deletion and consolidation of over 400 supplier duplicates in the ERP system; classification of all procurements according to eCl@ss.
- Mandatory baseline governance: Introduction of a monthly alignment meeting between the Head of Procurement and Head of Controlling to validate hard savings.
- E-procurement catalogues: integration of standardised webshops for C-parts to curb tail-spend purchases.
- Supplier scorecards: automated evaluation of delivery reliability and direct renegotiation in the event of poor performance.
3. Measurable results after 12 months:
- Spend under Management: Increased from 52 % to 86 %
- Maverick Buying: Reduced from 27 % to below 4 %
- OTIF rate: Improved from 76 % to 93 %
- EBIT effect: €2.4 million of audited P&L-effective savings, which were booked directly into the financial statements without discussion
7. Step-by-step implementation of a KPI dashboard
- Cleanse ERP database: consolidate master data, remove duplicates, and structure product groups hierarchically.
- Create controlling policy: Define in writing how savings, price increases, and baselines are calculated and approved.
- Select core KPIs: Focus on a maximum of 8 to 10 business-relevant metrics instead of overloading a dashboard with countless detailed values.
- Set up automated data pipelines: feed data directly from ERP, SRM and accounting systems into BI tools (such as Power BI or Tableau).
- Establish monthly performance reviews: Fixed review routines between purchasing, department heads and finance to derive concrete renegotiation and process measures.
8. Common pitfalls in practice and best practices
- Pitfall 1: Savings without a budget cut: Purchasing negotiates a lower unit price, but the department simply buys a larger quantity due to the unchanged budget.
Best Practice: Linking negotiated savings to budget management: If purchasing achieves a saving, the requesting department's non-personnel costs budget is adjusted accordingly. - Pitfall 2: Sole focus on unit price: Negotiated low prices lead to substandard material quality, increased scrap rates and expensive rework.
Best Practice: Embedding Total Cost of Ownership (TCO) and quality KPIs (PPM rates) in buyers' performance targets. - Pitfall 3: Excel graveyards instead of automated dashboards: Key performance indicators are manually copied and pasted into spreadsheets every month, leading to errors and outdated data.
Best Practice: Use of direct interfaces between financial accounting (FI), materials management (MM) and BI visualisations.
9. Conclusion: Creating value through procurement control and relevant KPIs in procurement
A professional purchasing controlling transforms purchasing from an operational order trigger into a strategic value driver for corporate management. The lever lies not in tracking countless individual data points, but in focusing on a few decision-relevant key figures. When hard savings are audited together with financial controlling and supplemented by key figures on delivery quality, process automation and risk management, procurement makes a measurable and sustainable contribution to the company's bottom line.
10. Frequently Asked Questions (FAQ) on Procurement Controlling & KPIs in Procurement
What is the difference between cost reduction and cost avoidance?
Cost reduction is past-oriented: the company pays less for the same product than in the previous year. This amount directly relieves the P&L. Cost avoidance describes avoided costs, for example when an announced supplier increase of 8 percent is negotiated down to 2 percent. This protects the budget from additional burdens, but does not lower historical costs.
How can the maverick buying rate be reliably determined?
For this purpose, the accounting documents in the ERP system (FI module) are reconciled with the approved purchase orders from purchasing (MM module). Every invoice without an attached purchase order number, blanket purchase agreement reference, or prior approval by purchasing flows into the key performance indicator as maverick buying.
What impact does an improved OTIF rate have on working capital?
If suppliers deliver on time and in the ordered quantities (high OTIF rate), the company can reduce safety stocks and buffer warehouses. This decreases tied-up capital in inventory and directly improves liquidity.
What is the function of purchasing controlling in the Supply Chain Due Diligence Act (LkSG)?
Purchasing controlling manages risk monitoring. It records, on a KPI basis, how many suppliers have submitted a self-declaration, what proportion of high-risk suppliers have been audited, and which corrective measures have been initiated in the event of violations.
At what intervals should purchasing KPIs be reported?
Operational metrics such as the OTIF rate, open purchase requisitions and the maverick buying rate belong in a monthly report for operational purchasing management. Strategic management indicators such as spend under management, P&L-effective savings and risk scores are generally discussed quarterly in the management review with the executive board and the CFO.